
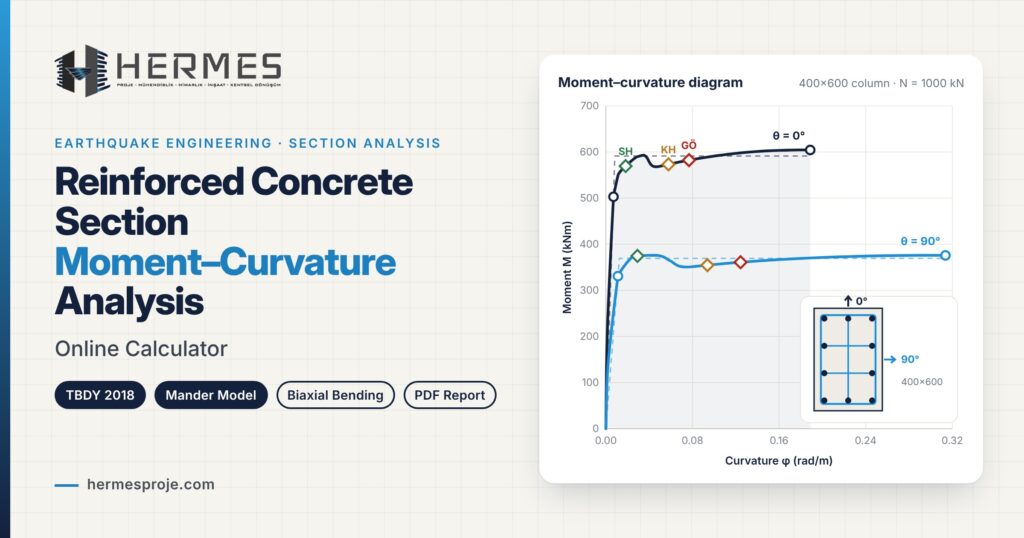
What Is Moment–Curvature Analysis?
The moment–curvature relationship describes how a reinforced concrete section deforms under bending. As an increasing curvature is imposed on the section, the internal forces carried by the concrete and the reinforcement produce a bending moment. Plotting this moment against the curvature gives the moment–curvature curve, also called the moment–curvature diagram. The curve captures the complete behaviour of the section in a single line: from the elastic range through cracking and yielding of the reinforcement, up to the ultimate state.
Moment–curvature analysis is one of the cornerstones of displacement-based assessment and design in earthquake engineering. Knowing how much moment a column or beam can carry is not enough on its own; how much the section can deform while carrying that moment — in other words, how ductile it is — matters just as much as its strength. Earthquake-resistant design aims for members that dissipate energy through deformation instead of failing in a sudden, brittle manner. A moment–curvature calculation quantifies exactly this ductility capacity.
What Does a Moment–Curvature Curve Show?
The moment–curvature curve of a typical reinforced concrete section has several distinct stages:
- Uncracked stage: The concrete has not yet cracked and the section is stiff. The curve starts as a steep straight line. The point at which the tensile strength of concrete is reached is the cracking moment (Mcr).
- Cracked elastic stage: Concrete in the tension zone has cracked and the reinforcement carries the tensile force. Stiffness drops, but the response remains approximately linear.
- Yield point: The tension reinforcement reaches its yield strain. Beyond this point curvature increases rapidly while the moment grows only slightly. The yield moment and yield curvature are defined here.
- Plastic stage: The section reaches large curvatures, and its moment capacity is maintained thanks to confined concrete and strain-hardening steel.
- Ultimate state: The section reaches the end of its capacity when the confined concrete attains its maximum compressive strain or the reinforcement reaches its rupture strain. The curvature at this point is the ultimate curvature (φu).
The ratio of ultimate curvature to yield curvature is the curvature ductility (μφ = φu/φy). The larger this ratio, the greater the capacity of the section to dissipate energy during an earthquake without losing its strength.
Moment–Curvature Analysis According to TBDY 2018
The Turkish Building Earthquake Code (TBDY 2018) clearly defines the material models and the allowable strain limits to be used in displacement-based assessment with nonlinear methods. The main elements considered in a TBDY 2018 moment–curvature analysis are as follows.
Confined and Unconfined Concrete Model
Annex 5A of the code gives stress–strain relations for confined and unconfined concrete. These relations are based on the approach known in the literature as the Mander model. Hoops and cross-ties confine the core concrete laterally, increasing both its compressive strength and its deformation capacity. The confined concrete strength (fcc) is computed from the effective confining stress and the confinement effectiveness coefficient. Tie spacing, tie diameter, number of legs and the arrangement of longitudinal bars all directly affect confinement effectiveness. The cover concrete is unconfined and loses its capacity beyond a certain compressive strain.
Reinforcing Steel Model
For reinforcing steel, the code defines a model consisting of an elastic branch, a yield plateau and a strain-hardening branch. The yield strength, strain-hardening onset and rupture strain of steel grades such as S220, S420, B420C and B500C are given in Table 5A.1. Strain hardening plays an important role in maintaining moment capacity at large curvatures.
Performance Levels: Limited Damage, Controlled Damage and Collapse Prevention
Section 5.8.1 of TBDY 2018 defines the allowable strains for new reinforced concrete members at three performance levels:
- Limited Damage (SH): Low strain limits for concrete and steel; the member is expected to remain usable after the earthquake with light damage.
- Controlled Damage (KH): Repairable damage; the limits are taken as 75% of those for Collapse Prevention.
- Collapse Prevention (GÖ): Severe damage is allowed but collapse is prevented. The concrete strain limit depends on the mechanical ratio of the effective confinement reinforcement.
In a moment–curvature analysis, the curvatures corresponding to these limits are determined, and the plastic curvature and plastic rotation capacities are computed. According to the code, the plastic hinge length is taken as half of the section dimension in the working direction. The effective yield moment may be based on the state in which concrete reaches a strain of 0.0035 and steel reaches 0.01. For new buildings the expected (mean) material strengths of Table 5.1 are used; for existing buildings, the in-situ strengths determined according to Chapter 15 apply.
Section Analysis with the Fiber Method
The most widely used computer-based section analysis technique is the fiber method. The section is divided into many thin strips or cells, and each reinforcing bar is modelled individually. Assuming that plane sections remain plane, the strain in every fiber is found for a given curvature and axial strain. Stresses are obtained from the material models, and internal forces from the stresses. The neutral axis position is adjusted iteratively until axial equilibrium is satisfied, giving the moment for that step. By increasing the curvature step by step, the complete moment–curvature response is built.
The main advantage of the fiber method over hand calculations is that it handles the confined core and unconfined cover, bars of different diameters and the effect of axial load realistically and simultaneously. Axial load significantly changes the moment–curvature behaviour of columns: as compression increases, moment capacity may rise up to a point, but ductility generally decreases. For this reason, a column moment–curvature analysis should always be performed under the actual axial load.
Biaxial Bending and the Mx–My Contour
In real structures, columns are often subjected to bending in two directions at the same time. A rectangular column behaves differently at 0° and 90°; at intermediate angles, the neutral axis is not perpendicular to the moment direction and the section “drifts” towards its strong axis. A correct biaxial bending analysis keeps the direction of the moment vector fixed and re-determines the neutral-axis angle at every step from the equilibrium conditions.
Combining the maximum moments obtained for different directions in the Mx–My plane yields the Mx–My contour (moment interaction contour). This diagram shows, at a glance, the bending capacity of the section in every direction under a given axial load. For sections with asymmetric reinforcement, the capacities in the positive and negative directions differ, and the contour makes this difference clearly visible.
How to Use the Online Moment–Curvature Calculator
The online moment–curvature calculator on this page runs the fiber method described above directly in your browser for rectangular and circular reinforced concrete sections. The steps are:
- Select the section type: rectangular or circular.
- Enter the geometry: section dimensions and clear cover.
- Define the longitudinal reinforcement: in the symmetric layout enter corner and inner bars; in the free layout define each corner and each face separately.
- Enter the transverse reinforcement: tie diameter, spacing and number of legs in both directions; for circular sections choose a spiral or circular hoop.
- Select the materials: characteristic concrete and steel strengths, and the strength basis for a new or existing building.
- Enter the axial load and the shear span.
- Choose the analysis directions: 0° and 90° are computed together by default; all directions at 15° intervals can also be selected.
- Press Calculate and review the results. You can download a report containing all data as a PDF.
The tool tabulates the cracking, first yield, effective yield, maximum moment, Limited Damage, Controlled Damage and Collapse Prevention points, and the ultimate state. The moment–curvature diagram, concrete and steel stress–strain curves, the strain distribution over the section and the Mx–My contour are presented graphically. Optionally, the column requirements of TBDY 2018 Chapter 7 are also checked.
How to Interpret the Results
When evaluating moment–curvature results, the first values to look at are the maximum moment, the idealized yield moment and the curvature ductility. A bilinear idealization represents the actual curve with an elastic and a plastic line segment; structural analysis programs generally use these idealized values to define plastic hinges. It also matters which material governs at each performance point: cases governed by concrete compressive strain can be improved by increasing the confinement reinforcement, whereas cases governed by steel tensile strain relate to the longitudinal reinforcement arrangement.
The plastic rotation capacity is compared with the rotation demands obtained from seismic analysis to determine the performance level of the member. Columns with a high axial load ratio show a marked drop in ductility, which may call for a review of the column dimensions and the confinement reinforcement.
Frequently Asked Questions
Which members require a moment–curvature analysis?
It is most commonly performed for columns, beams and shear-wall boundary regions. The moment–curvature relationship of the sections is needed to define plastic hinge properties in nonlinear static (pushover) and time-history analyses.
How does axial load affect the moment–curvature curve?
As compression increases, the neutral axis deepens and the yield moment rises up to a point, but the ultimate curvature and curvature ductility decrease. Column sections should therefore be analysed under their actual axial load.
Why is confinement reinforcement so important?
Hoops and cross-ties confine the core concrete, increasing its compressive strength and, above all, its deformation capacity. Closely spaced, well-detailed confinement raises the concrete strain limit at the Collapse Prevention level and directly increases the ductility of the section.
Why do the 0° and 90° results of a rectangular column differ?
Because the section dimensions and bar arrangement differ in the two directions, the flexural stiffness, moment capacity and ductility also differ. This is why the tool computes both directions together by default.
What is the difference between moment–curvature and moment–rotation?
Moment–curvature describes the behaviour of a section, while moment–rotation describes the behaviour of a member region of a certain length. Plastic curvature is converted into plastic rotation by multiplying it by the plastic hinge length.
Can the results be used directly in an engineering project?
The tool uses the material models and strain limits defined in the code and lists every assumption explicitly in the report. Nevertheless, the results should be evaluated with the judgment of the responsible structural engineer and verified by detailed analyses where necessary.
If you need engineering support for moment–curvature analysis of reinforced concrete sections, seismic performance assessment, retrofitting or urban transformation projects, you can contact the Hermes Proje Engineering, Architecture and Construction team.